ELEC: LD21 Leads All Districts with Money Raised and Spent
Two years after a legislative election that smashed spending records, the fall campaign for 80 state
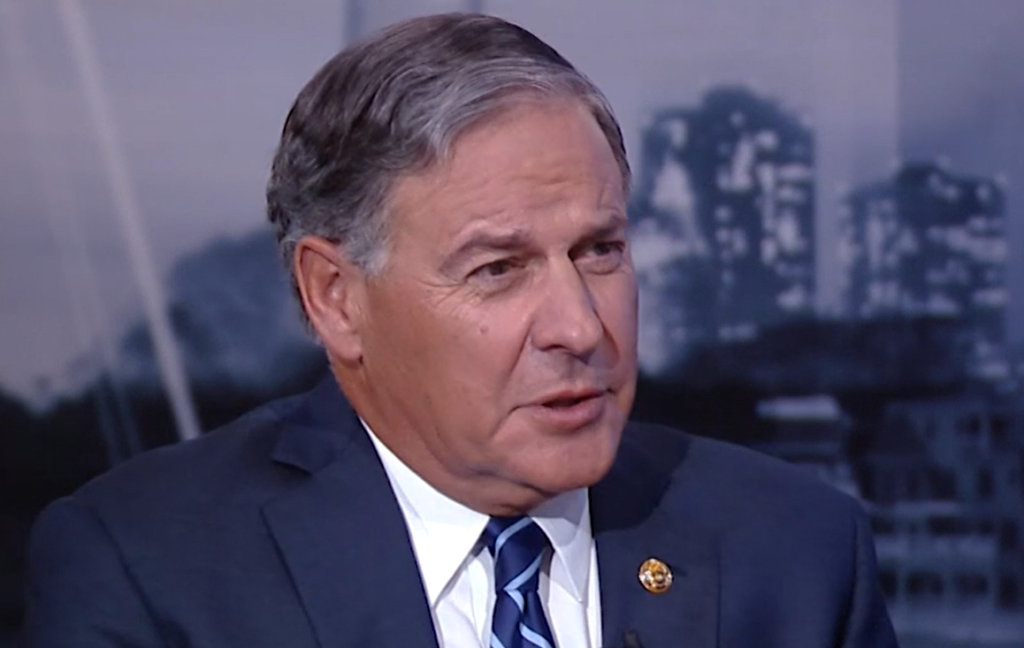
[caption id="attachment_1136" align="alignleft" width="300"] Jeff Brindle, Executive Director of the New Jersey Election Law Enforcement Commission, with Joe Donohue, ELEC researcher extraordinare.[/caption]
Assembly seats and one state Senate seat is off to a sluggish start, according to 29-day pre-election reports filed with the New Jersey Election Law Enforcement Commission (ELEC).
Legislative candidates have raised $14.3 million but spent just $7.1 million so far. The total is based on
reports due October 7 that reflect financial activity through October 4.
Legislators in the last election had already spent $12.2 million- 72 percent more- though it should be noted that all 40 Senate seats also were in play during 2017.
The $7.1 million spent this year is higher than the $6.6 million spent in 2015, another year when Assembly candidates had the ballot to themselves. The 2019 election occurs November 5.
The main reason overall spending is down sharply is because reported independent spending to date has
reached just $728,046. That is nearly 15 times less than the $10.7 million spent independently at this point in 2017. It is also smaller than the $5.4 million spent by independent groups in 2015.
[caption id="attachment_23346" align="alignnone" width="768"]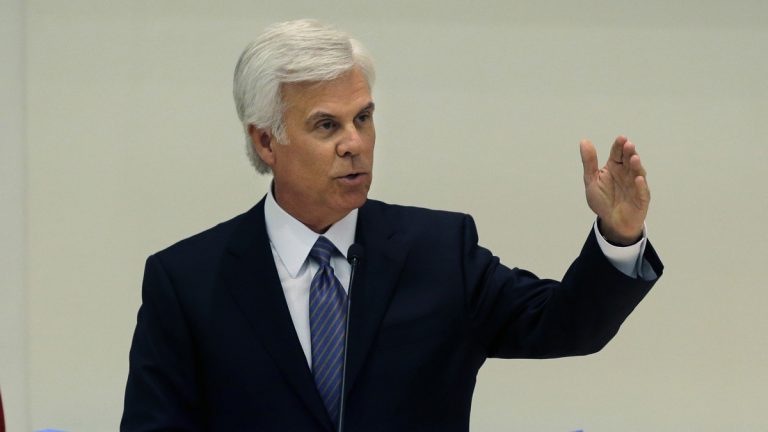 George Norcross III, Democratic Party Power Broker, whose General Majority PAC is a factor in this year's elections.[/caption]
Table 1
Legislative Campaign Spending For 29-Day Reporting Period
YEAR LEGISLATIVE INDEPENDENT GROUPS TOTAL TYPE
2019* $ 7,109,902 $ 728,0461 [General Majority PAC ($393,337) and Garden State Forward ($334,709)]. $ 7,837,948 A
2017 $12,191,375 $10,695,427 $22,886,802 A/S
2015 $ 6,589,670 $ 5,393,739 $11,983,409 A
*Legislative total includes spending on a special election for first legislative district state Senate seat.
“It is still early in the race. In some elections, the heaviest spending comes during the last week or two of
the campaign,” said Jeff Brindle, ELEC’s Executive Director.
“However, it also could be that most of this year’s races are not viewed as very competitive. Both parties
and independent groups may be saving their campaign dollars until next year, when presidential and congressional elections will take place,” he said.
The 2017 legislative election featured the highest spending (nearly $19 million) ever nationally in a state
legislative race. It involved the third legislative district. None of the 2019 legislative skirmishes are likely to come close to that figure.
Based on historical trends and pre-election forecasts, the top six districts reporting the most fundraising1,8,11,16,21, and 25- all are viewed among the most likely “battleground” districts this fall.
There are 40 legislative districts in New Jersey.
“Battleground districts tend to be those with the tightest voting margins in previous elections. Both parties view them as winnable, so they tend to be the most expensive elections,” said Brindle.
Nearly 40 percent of all campaign funds have poured into the top six districts. Nearly two-thirds of total
spending statewide has occurred in those six districts alone.
For the top 10 districts, the percentages are even higher- 52 percent of fundraising and 73 percent of
spending.
[caption id="attachment_67335" align="alignnone" width="1614"]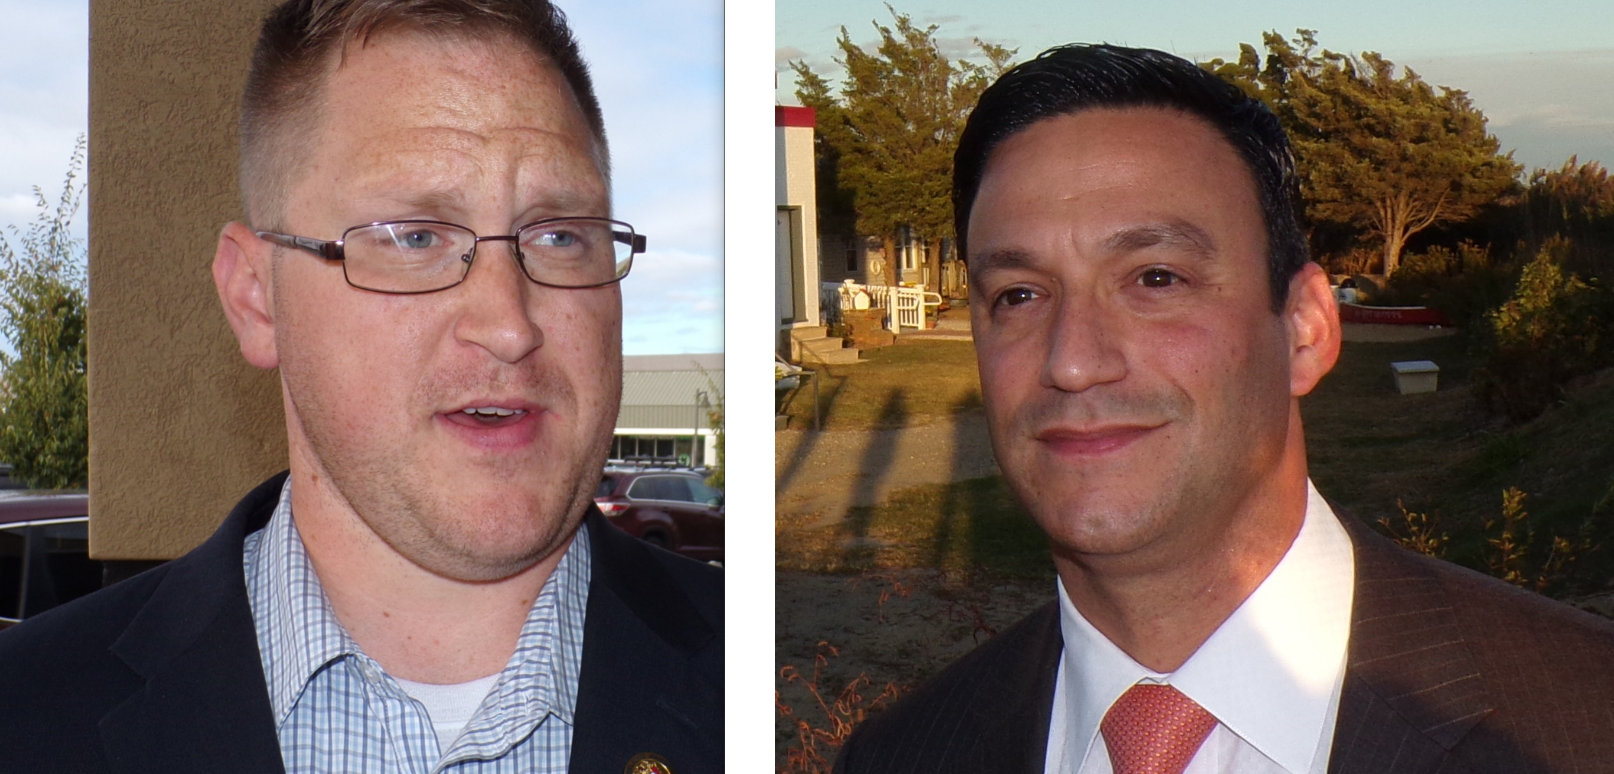 LD1 Battleground: Democratic Senator Robert "Bob" Andrzejczak, left, and his challenger, Republican Michael "Mike" Testa, right.[/caption]
Table 2
Legislative District Spending Top Ten Districts Through October 4, 2019
DISTRICT RAISED SPENT CASH
21 $1,252,504 $ 960,897 $ 291,608
11 $ 956,552 $ 771,013 $ 185,539
16 $ 858,584 $ 757,495 $ 101,089
1* $ 982,847 $ 665,917 $ 316,930
8 $ 789,708 $ 535,828 $ 253,880
25 $ 626,357 $ 391,026 $ 235,331
19 $ 607,384 $ 373,257 $ 234,127
2 $ 516,172 $ 286,586 $ 229,586
14 $ 510,814 $ 244,358 $ 266,456
38 $ 317,308 $ 189,323 $ 127,985
Totals- Top 6 $5,466,551 $4,082,175 $1,384,376
Top 6 as % of All 40 Districts 38% 57% 19%
Totals- Top 10 $7,418,229 $5,175,700 $2,242,529
Top 10 As % of All 40 Districts 52% 73% 31%
*Includes spending on state Senate special election. All other districts involve Assembly candidates only.
[caption id="attachment_67372" align="alignnone" width="1880"] LD8 slates: LaPlaca, Natale, Peters, and Stanfield.[/caption]
“Battleground districts always dominate spending,” said Brindle. “Spending in most other districts around the state is lighter because incumbents of both parties face little risk of losing due to redistricting.”
Democrats hold a 54-to-26 margin in the Assembly. They have held the majority since 2002, and they are raising and spending more money than Republican or independent candidates.
[caption id="attachment_67325" align="alignnone" width="4608"]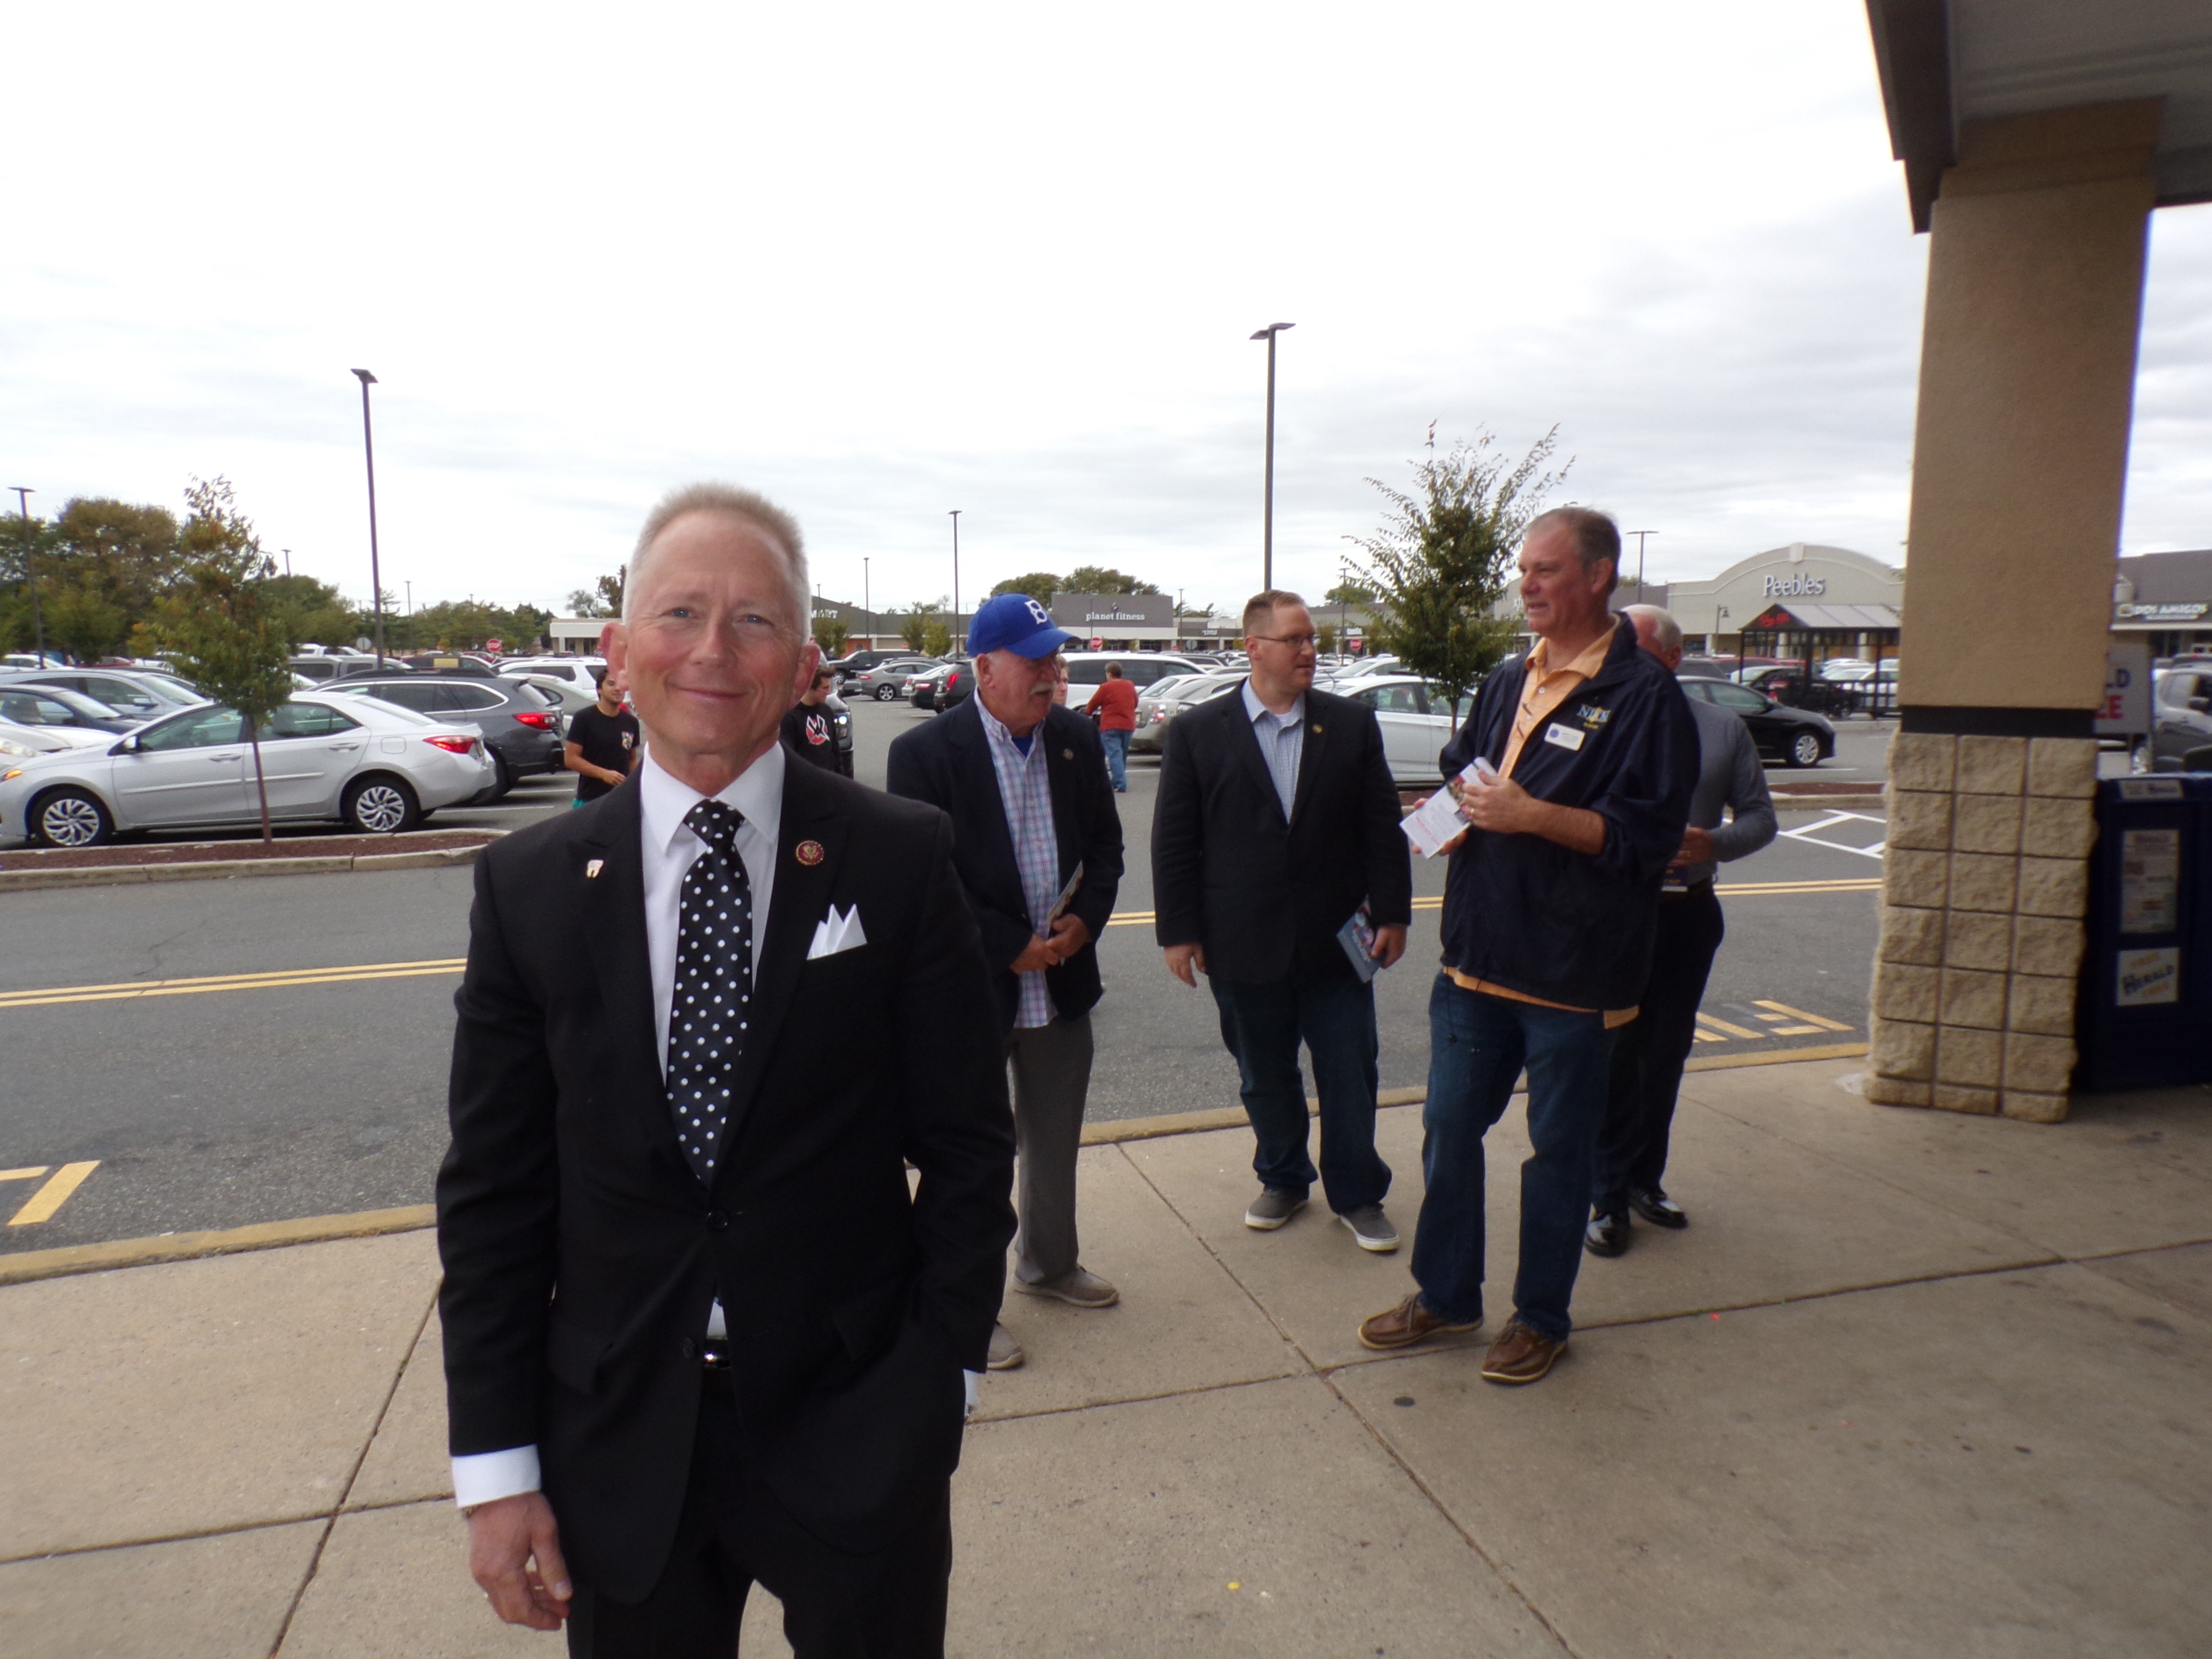 Democrats are outspending Republicans 5-1, according to ELEC.[/caption]
Table 3
Breakdown of Legislative Campaign Finance Activity by Party through October 4, 2019
PARTY RAISED SPENT CASH-ON-HAND
Democratic Candidates $10,999,897 $5,733,701 $5,266,196
Independent Candidates $ 16,854 $ 4,465 $ 12,389
Republican Candidates $ 3,269,185 $1,371,736 $1,897,449
All Parties $14,285,936 $7,109,902 $7,176,034
Incumbents benefit from a big advantage over challengers in terms of fundraising, raising more than four times more money than newcomers and spending nearly three times more. They also have more than seven times more cash to spend with the election less than a month away.
[caption id="attachment_66796" align="alignnone" width="752"]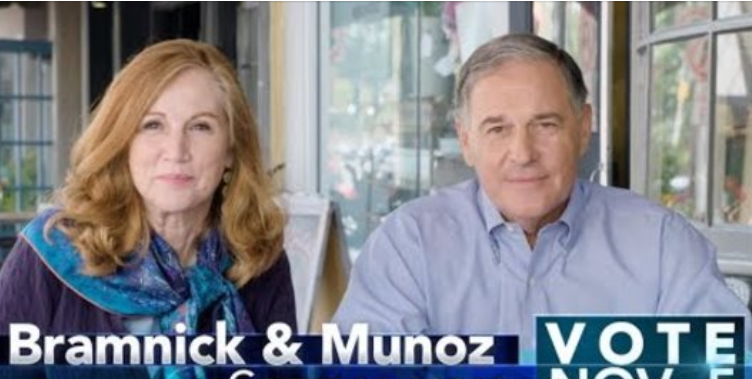 Incumbents outspending challengers this cycle: Bramnick and Munoz.[/caption]
Table 4
Breakdown of Spending by Incumbents and Challengers through October 4, 2019
PARTY RAISED SPENT CASH-ON-HAND
Incumbents $11,458,563 $5,160,075 $6,298,488
Challengers $ 2,827,374 $1,949,828 $ 877,546
All Candidates $14,285,936 $7,109,902 $7,176,034
The numbers in this report should be considered preliminary. The analysis is based on reports received
by October 15, 2019.
Reports filed by legislative candidates are available online on ELEC’s website at www.elec.state.nj.us. A
downloadable summary of data from those reports is available in both spreadsheet and PDF formats at
www.elec.state.nj.us/publicinformation/statistics.htm.
[pdf-embedder url="https://www.insidernj.com/wp-content/uploads/2019/10/PR_10162019A.pdf"]


