
Monmouth Poll: Inflation, Supply Chain Issues Impact Holiday Shopping
About 4 in 10 Americans report experiencing a higher than usual level of supply chain problems this holiday season and many have pared down their shopping lists due to rising prices. The Monmouth University Poll finds that gift-giving and traveling are the top stressors this holiday season. Overall, 3 in 10 say they feel more holiday stress this year than during pre-pandemic holiday seasons and the number of people who find the holidays more enjoyable than other times of the year has declined.
Four in ten Americans have cut back on their holiday shopping lists this year because of high prices – 19% have cut back a lot and 21% a little, while nearly half (48%) say they are purchasing the same amount of gifts as usual. Another 10% say they don’t shop for the holidays or wait until later. Those who make less than $100,000 a year (46%) are more likely than higher earners (26%) to report paring down their gift lists this year. Also, more women (45%) than men (36%) say high prices are causing them to make cuts.
Between a third and just under a half of Americans have experienced an increase in supply chain problems while shopping for gifts this year. This includes items being out of stock at stores (46% say this has happened more often than usual compared to past years), items being out of stock online (41%), and packages being delayed or going missing (34%).
Despite these experiences with supply chain problems, the country as a whole has not made much of a change to its typical holiday shopping timeline. Just 22% of the public reports getting most of their shopping done by the end of November and 32% expect to wrap things up by mid-December. Another third (36%) will leave the bulk of their shopping until the last ten days before Christmas. These results are nearly identical to shopping timeframe intentions reported in Monmouth’s 2018 poll.
“Inflation and supply chain problems are having an impact on holiday shopping. It appears that most Americans are trying to make this year as normal as they can, but it may be taking some of the joy out of the season,” said Patrick Murray, director of the independent Monmouth University Polling Institute.
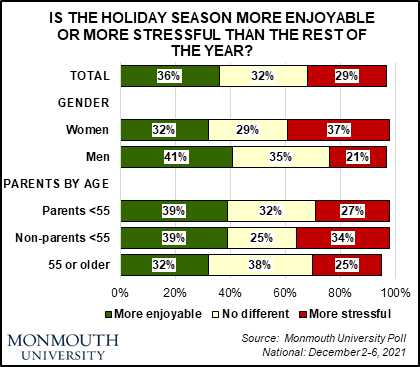
Just over 1 in 3 Americans (36%) find the holiday season to be more enjoyable than the rest of the year. This number has declined from 44% in 2015 and 41% in 2018. At the same time, 29% feel that the holidays are more stressful than the rest of the year, which has not really changed over the past six years (27% in 2015 and 29% in 2018).
Even though the number of people who report feeling the holiday season is more stressful than the rest of the year remains unchanged, about 3 in 10 (29%) American adults say they are experiencing more stress now compared to pre-pandemic holiday seasons. Another 10% say they actually have less stress than they did before Covid. When asked to compare their current holiday stress to last year – a time when the Covid infection rate was reaching its peak – 34% say they have less stress now, while 19% say they actually have more holiday stress than they did in 2020.
Overall, similar numbers of parents with children under age 18 (39%), adults under age 55 who do not have children (39%), and adults age 55 and older (32%) say they find the holidays more enjoyable than the rest of the year. However, non-parents under age 55 (34%) are somewhat more likely than parents (27%) or adults age 55 and older (25%) to say the holidays are more stressful. Non-parents under 55 years old (36%) are also somewhat more likely than parents (24%) and older adults (24%) to say that this year’s season is more stressful than pre-Covid holidays.
“It is interesting that non-parents are feeling relatively more stress from the holidays. Perhaps that’s because parents have been making more adjustments to their lives during Covid and that has become the new normal for them,” said Murray.
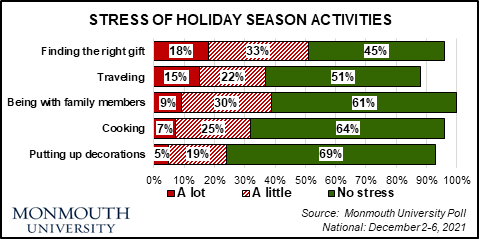
Overall, 51% of Americans say finding the right gifts causes them at least a little stress during the holidays and 37% say the same about traveling. Other holiday stressors include being with family members (39%), cooking (32%), and putting up holiday decorations (24%). Among these five different holiday activities, the two that are most commonly identified as the top stressors are finding the right gifts (28%) and traveling (24%). The percentage of Americans who choose gift-buying as their biggest stressor is unchanged from 2018 (28%), but the number who point to traveling as causing them the most stress has ticked up from 17% three years ago.
Overall, 48% of non-parents under age 55 get stressed from traveling (similar to 45% in 2018). This problem is lower for parents (30%, which is down from 41% in 2018) and those age 55 and older (30%, up from 21% in 2018). Gift-buying is more likely to be seen as a source of stress for adults under 55 years old – whether they are parents (61%) or not (55%) – than it is for those age 55 and older (43%). These results are virtually unchanged from 2018.
The Monmouth University Poll was conducted by telephone from December 2 to 6, 2021 with 808 adults in the United States. The question results in this release have a margin of error of +/- 3.5 percentage points. The poll was conducted by the Monmouth University Polling Institute in West Long Branch, NJ.
QUESTIONS AND RESULTS
(* Some columns may not add to 100% due to rounding.)
[Q1-11 previously released.]
[Q12-19 held for future release.]
20. Do you celebrate Christmas, Hanukkah, Kwanzaa, or none of these holidays? [If YES: Which?] [Note: Results add to more than 100% because multiple responses were accepted.]
|
TREND: |
Dec.2021 |
Nov.2018 |
Dec.2017 |
Dec.2015 |
|
Christmas |
91% |
90% |
89% |
94% |
|
Hanukkah |
7% |
6% |
5% |
6% |
|
Kwanzaa |
5% |
4% |
3% |
3% |
|
None of these |
7% |
7% |
8% |
4% |
|
(VOL) Don’t know |
1% |
1% |
1% |
1% |
|
(n) |
(808) |
(802) |
(806) |
(1,006) |
21. Do you find the holiday season generally more enjoyable or more stressful than the rest of the year, or is it no different?
|
TREND: |
Dec.2021 |
Nov.2018 |
Dec.2015 |
|
More enjoyable |
36% |
41% |
44% |
|
More stressful |
29% |
29% |
27% |
|
No different |
32% |
27% |
23% |
|
(VOL) Both |
2% |
3% |
5% |
|
(VOL) Don’t know |
0% |
0% |
0% |
|
(n) |
(808) |
(802) |
(1,006) |
22. Thinking back to pre-Covid holiday seasons, are you currently feeling more stress, less stress, or about the same amount of stress as you did during the holidays before the pandemic?
|
|
Dec.2021 |
|
More |
29% |
|
Less |
10% |
|
About the same |
59% |
|
(VOL) Don’t know |
2% |
|
(n) |
(808) |
23. Now think back to about a year ago. Are you currently feeling more stress, less stress, or about the same amount of stress as you did during the holidays last year?
|
|
Dec.2021 |
|
More |
19% |
|
Less |
34% |
|
About the same |
46% |
|
(VOL) Don’t know |
1% |
|
(n) |
(808) |
24. During the holiday season, how much stress does each of the following activities cause you? First, [READ ITEM] – does that cause you a lot, a little, or no stress at all? [ITEMS WERE ROTATED]
Putting up holiday decorations
|
TREND: |
Dec.2021 |
Nov.2018 |
|
A lot |
5% |
6% |
|
A little |
19% |
22% |
|
No stress at all |
69% |
66% |
|
(VOL) Don’t engage in that activity |
8% |
5% |
|
(VOL) Don’t know |
0% |
1% |
|
(n) |
(808) |
(802) |
Finding the right gifts
|
TREND: |
Dec.2021 |
Nov.2018 |
|
A lot |
18% |
19% |
|
A little |
33% |
33% |
|
No stress at all |
45% |
45% |
|
(VOL) Don’t engage in that activity |
3% |
3% |
|
(VOL) Don’t know |
0% |
1% |
|
(n) |
(808) |
(802) |
Traveling
|
TREND: |
Dec.2021 |
Nov.2018 |
|
A lot |
15% |
11% |
|
A little |
22% |
25% |
|
No stress at all |
51% |
55% |
|
(VOL) Don’t engage in that activity |
11% |
9% |
|
(VOL) Don’t know |
0% |
0% |
|
(n) |
(808) |
(802) |
Cooking
|
TREND: |
Dec.2021 |
Nov.2018 |
|
A lot |
7% |
9% |
|
A little |
25% |
19% |
|
No stress at all |
64% |
67% |
|
(VOL) Don’t engage in that activity |
4% |
5% |
|
(VOL) Don’t know |
0% |
0% |
|
(n) |
(808) |
(802) |
Being with family members
|
TREND: |
Dec.2021 |
Nov.2018 |
|
A lot |
9% |
11% |
|
A little |
30% |
24% |
|
No stress at all |
61% |
63% |
|
(VOL) Don’t engage in that activity |
1% |
1% |
|
(VOL) Don’t know |
0% |
0% |
|
(n) |
(808) |
(802) |
25. And which of the things I just mentioned causes you the most stress during the holidays?
|
TREND: |
Dec.2021 |
Nov.2018 |
|
Putting up holiday decorations |
4% |
7% |
|
Finding the right gifts |
28% |
28% |
|
Traveling |
24% |
17% |
|
Cooking |
9% |
9% |
|
Being with family members |
17% |
16% |
|
(VOL) Other |
1% |
2% |
|
(VOL) None, no stress |
16% |
15% |
|
(VOL) Don’t know |
1% |
6% |
|
(n) |
(808) |
(802) |
26. Did you get most of your holiday shopping done by the end of November, will you get most of it done by December 15, or will you get most of it done in the 10 days before Christmas?
|
TREND: |
Dec.2021 |
Nov.2018* |
|
By end of November |
22% |
19% |
|
By December 15 |
32% |
32% |
|
In the 10 days before Christmas |
36% |
38% |
|
(VOL) After Christmas |
0% |
1% |
|
(VOL) Do not shop for holidays |
7% |
6% |
|
(VOL) Don’t know |
2% |
3% |
|
(n) |
(808) |
(802) |
* 2018 question wording was “Will you get most of your holiday shopping done by the end of November …”
27. While shopping for gifts this year versus holiday seasons before the pandemic, how often have the following situations happened? [READ ITEM] – has this happened more often, less often, or about the same as in past years? [ITEMS WERE ROTATED]
Shipping delays or packages that have gone missing
|
|
Dec.2021 |
|
More often |
34% |
|
Less often |
8% |
|
About the same |
39% |
|
(VOL) Don’t know |
10% |
|
Do not shop for/before holidays (from Q26) |
10% |
|
(n) |
(808) |
Items you want have been out of stock online
|
|
Dec.2021 |
|
More often |
41% |
|
Less often |
7% |
|
About the same |
32% |
|
(VOL) Don’t know |
10% |
|
Do not shop for/before holidays (from Q26) |
10% |
|
(n) |
(808) |
Items you want have been out of stock in stores
|
|
Dec.2021 |
|
More often |
46% |
|
Less often |
7% |
|
About the same |
31% |
|
(VOL) Don’t know |
6% |
|
Do not shop for/before holidays (from Q26) |
10% |
|
(n) |
(808) |
28. Have you cut back your shopping list this year because of high prices, or are you purchasing the same amount of gifts as usual? [If CUT BACK: Have you cut back by a lot or just a little?]
|
|
Dec.2021 |
|
Cut back, a lot |
19% |
|
Cut back, a little |
21% |
|
Same amount as usual |
48% |
|
(VOL) Don’t know |
2% |
|
Do not shop for/before holidays (from Q26) |
10% |
|
(n) |
(808) |
METHODOLOGY
The Monmouth University Poll was sponsored and conducted by the Monmouth University Polling Institute from December 2 to 6, 2021 with a probability-based national random sample of 808 adults age 18 and older. This includes 285 contacted by a live interviewer on a landline telephone and 523 contacted by a live interviewer on a cell phone, in English. Telephone numbers were selected through a mix of random digit dialing and list-based sampling. Landline respondents were selected with a modified Troldahl-Carter youngest adult household screen. Interviewing services were provided by Braun Research, with sample obtained from Dynata (RDD, n=457), Aristotle (list, n=150) and a panel of prior Monmouth poll participants (n=201). Monmouth is responsible for all aspects of the survey design, data weighting and analysis. The full sample is weighted for region, age, education, gender and race based on US Census information (ACS 2018 one-year survey). For results based on this sample, one can say with 95% confidence that the error attributable to sampling has a maximum margin of plus or minus 3.5 percentage points (unadjusted for sample design). Sampling error can be larger for sub-groups (see table below). In addition to sampling error, one should bear in mind that question wording and practical difficulties in conducting surveys can introduce error or bias into the findings of opinion polls.
|
DEMOGRAPHICS (weighted) |
|
Self-Reported |
|
26% Republican |
|
44% Independent |
|
30% Democrat |
|
|
|
49% Male |
|
51% Female |
|
|
|
31% 18-34 |
|
33% 35-54 |
|
36% 55+ |
|
|
|
62% White |
|
12% Black |
|
17% Hispanic |
|
8% Asian/Other |
|
|
|
68% No degree |
|
32% 4 year degree |
|
MARGIN OF ERROR |
|||
|
unweighted sample |
moe(+/-) |
||
|
TOTAL |
|
808 |
3.5% |
|
SELF-REPORTED PARTY ID |
Republican |
193 |
7.1% |
|
Independent |
331 |
5.4% |
|
|
Democrat |
265 |
6.0% |
|
|
GENDER |
Male |
399 |
4.9% |
|
Female |
409 |
4.9% |
|
|
PARENTS BY AGE |
Under 55, parent |
162 |
7.7% |
|
Under 55, non-parent |
223 |
6.6% |
|
|
Age 55+ |
415 |
4.8% |
|
|
INCOME |
<$50K |
248 |
6.2% |
|
$50 to <$100K |
245 |
6.3% |
|
|
$100K+ |
250 |
6.2% |
|
|
RACE |
White, non-Hispanic |
561 |
4.1% |
|
Other |
216 |
6.7% |
|
|
COLLEGE GRADUATE |
No degree |
391 |
5.0% |
|
4 year degree |
414 |
4.8% |
|
Crosstabs may be found in the PDF file on the report webpage: https://www.monmouth.edu/polling-institute/reports/monmouthpoll_US_121321/


