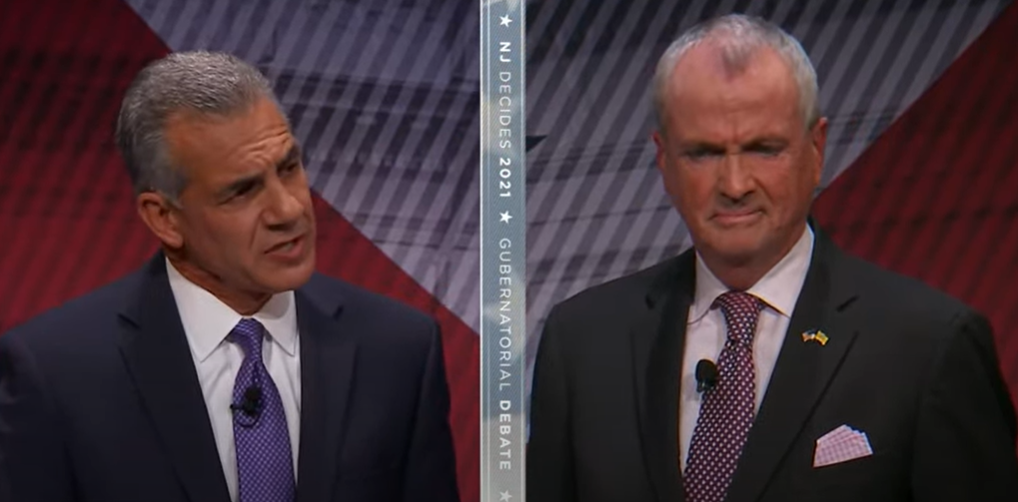
NJ 2021: Gov. Murphy with 6-Point Lead Over GOP Challenger Ciattarelli

Among those who have already voted, Murphy leads 76% to 24%. Murphy also leads among those who are somewhat likely to vote, 45% to 40%. Among very likely voters, Ciattarelli leads 48% to 45%. Independents are also leaning towards Ciattarelli, 56% to 32%.
Both Murphy and Ciattarelli’s favorability ratings in the state are split. Forty-nine percent (49%) view Murphy favorably and 47% view him unfavorably, with 3% having no opinion and 1% have never heard of him. Ciattarelli is viewed favorably by 40% and unfavorably by 40%, while 16% have no opinion and 4% have never heard of him.
A majority of likely voters (56%) agree with Governor Murphy’s vaccine mandates for public school staff, child care staff, and healthcare workers, while 38% disagree. Six percent (6%) were unsure or had no opinion.
Regarding which candidate likely voters think would best handle the COVID-19 recovery, a majority (52%) say Governor Murphy would best handle the COVID-19 recovery while 48% say Jack Ciattarelli would best handle the COVID-19 recovery.
A slim majority (51%) of New Jersey likely voters believe taxes should be the first priority for the next Governor. Sixteen-percent (16%) believe jobs should be the first priority, 13% healthcare, 6% New Jersey transit, 4% crime, and 9% believe something else should be the next Governor’s first priority. Among those voting for Governor Murphy, voters are split between taxes (30%), jobs (23%) and healthcare (22%) as the next Governor’s first priority, whereas the majority (74%) of those supporting Republican challenger Jack Ciattarelli say taxes should be the next Governor’s first priority.
Voters were asked to grade Governor Murphy’s response to Tropical Storm Ida. Twenty-three percent (23%) gave the Governor an A, 27% a B, 21% a C, 10% a D, and 20% an F. A majority (79%) of Democrats gave Murphy an A or B on his handling, while majorities of Independents (66%) and Republicans (78%) gave Murphy a C or lower.
Caller ID
The New Jersey Emerson College/PIX 11 poll was conducted October 15-18, 2021. The sample consisted of New Jersey likely voters, n=600, with a Credibility Interval (CI) similar to a poll’s margin of error (MOE) of +/- 3.9 percentage points. The data sets were weighted by gender, age, education, race, and region based on 2021 turnout modeling. It is important to remember that subsets based on gender, age, party breakdown, ethnicity, and region carry with them higher margins of error, as the sample size is reduced. Data was collected via a cellphone sample using SMS-to-web, a landline sample using IVR, and an online panel provided by Amazon MTurk.


